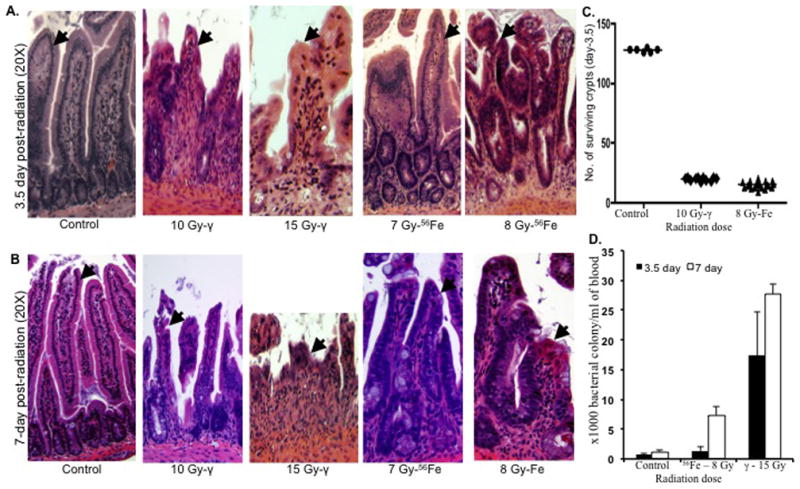
Figure 3.

Intestinal responses in mice (n=3 per group, per time point, and per radiation dose) after 56Fe and γ-radiation. A) H&E stained intestinal histology of jejunal sections at 3.5 d after exposure to γ (10 and 15 Gy) and 56Fe (7 and 8 Gy) radiation. Arrow shows epithelial lining and depicted images are at 20X magnification. B) H&E stained intestinal histology of jejunal sections at 7 d after exposure to γ (10 and 15 Gy) and 56Fe (7 and 8 Gy) radiation. Arrow shows epithelial lining and depicted images are at 20X magnification. C) Number of surviving crypts in jejunal sections at 3.5 d after exposure to 10 Gy of γ and 8 Gy of 56Fe radiation. D) Blood culture at 3.5 d and 7 d after exposure to γ (15 Gy) and 56Fe (8 Gy) radiation. Results are presented as bacterial colonies × 103 per ml of blood. *p<0.05 compared to 3.5 d counts for both γ and 56Fe radiation. Error bars represent the standard error of the mean (SEM).
