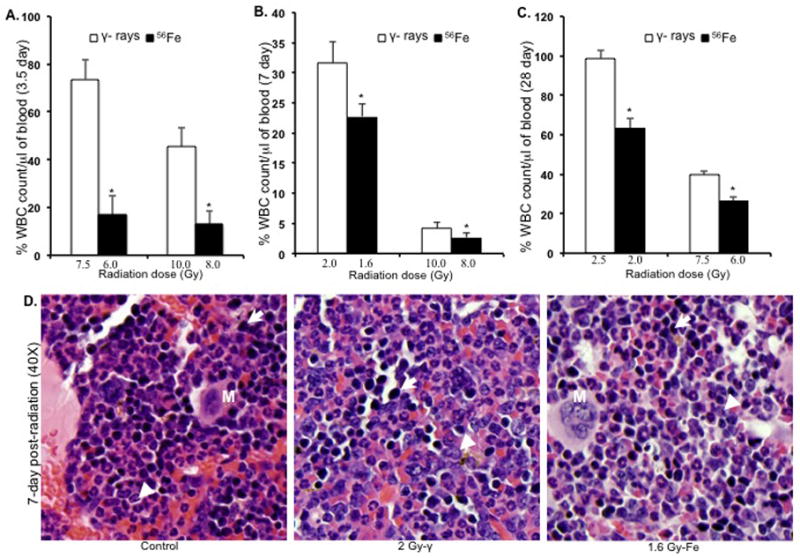
Figure 4.

Peripheral white blood cell (WBC) counts and bone marrow histology (n=3 mice per group, per time point, and per radiation dose). A) WBC counts at 3.5 d after 7.5 and 10 Gy of γ and equitoxic doses (6 and 8 Gy) of 56Fe radiation. *p<0.004 compared to γ radiation. B) WBC counts at 7 d after 2 and 10 Gy of γ and equitoxic doses (1.6 and 8 Gy) of 56Fe radiation. *p<0.05 compared to γ radiation. C) WBC counts at 28 d after 2.5 and 7.5 Gy of γ and equitoxic doses (2 and 6 Gy) of 56Fe radiation. *P<0.04 compared to γ radiation. D) Bone marrow histology at 7 d after 2 Gy and equitoxic dose (1.6 Gy) of 56Fe showing apparent difference in myeloid precursor cell population. Presented images are at 40X magnification. Arrow: erythroid precursor; Arrowhead: myeloid precursor; M: megakaryocyte. Error bars represent the standard error of the mean (SEM).
