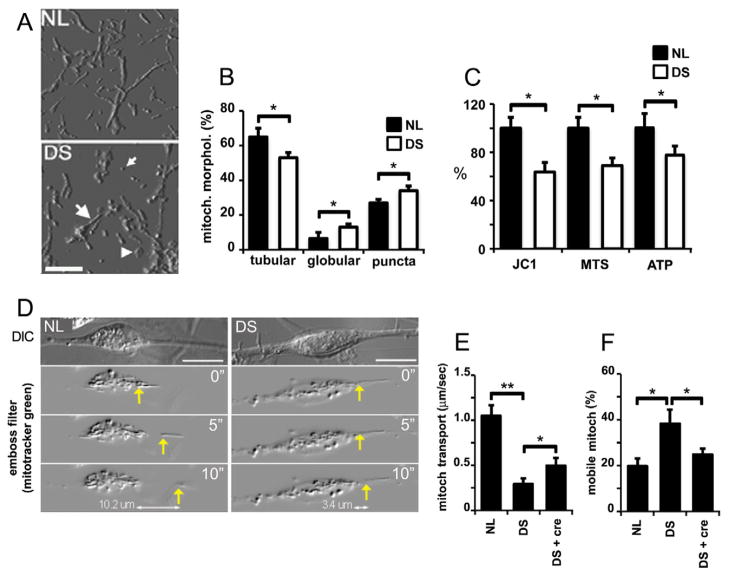
Figure 3. Altered mitochondrial morphology and function in DS neurons.
(A) Mitochondria in NL and DS neurons (21 DIV) visualized with anti-cyt C antibody. Images were processed with an emboss filter. Mitochondria were classified as tubular (large arrow), puncta (small arrow), and globular (arrowhead). Scale bar: 5 μm.
(B) Quantification of mitochondrial morphotypes expressed as a percent of total mitochondrial mass. Tubular mitochondria are reduced while puncta- and globular-shaped mitochondria are increased in DS cells. *p < 0.05
(C) Reduced mitochondrial function in DS neurons. MMP is expressed as a JC-1 red/green ratio (JC-1). Ox/red activity (MTS) and ATP levels (ATP) were assessed using commercial assays. Results are expressed as a percent of the values found in NL cultures. DS cultures exhibit significant reductions in all three parameters. Values for each treatment were normalized to LDH cellular levels. *p<0.05
(D) Mitochondrial transport in NL and DS neurons (upper panel, DIC images) was recorded after live staining with Mitotracker green and processed with an emboss filter. Images correspond to 0, 5, and 10 sec respectively in both NL and DS neurons (yellow arrows). Travelled distance is specified in the bottom panel. Scale bar: 10 μm.
(E) Quantification of mitochondrial transport. DS mitochondria move slower than NL mitochondria. Creatine (5 mM; DS+cre) increased DS mitochondrial velocity (cre: 5 mM creatine). *p<0.05 and **p<0.01
(F) Quantification of mobile mitochondria. NL and DS neurons were labeled with Mitotracker green. Images acquired at 0 and 20 sec time-points were subtracted to generate a ratio of stationary over moving mitochondria (see SMethods). The number of moving mitochondria was higher in DS neurons and it was reduced to NL levels by treatment with 5 mM creatine (DS+cre) *p<0.01
Statistics: (B) and (C), by Student’s t test; (E) and (F), by one way ANOVA followed by Tukey HSD test.

