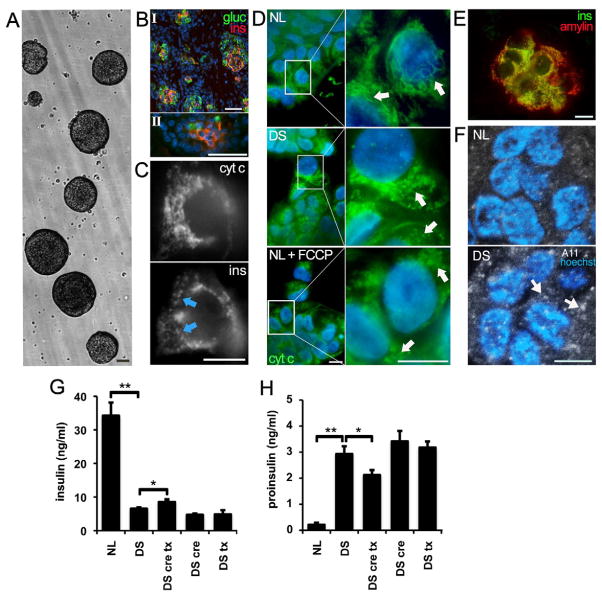
Figure 4. Altered mitochondrial morphology and function in DS pancreatic β cells.
(A) Fetal human pancreatic cells were grown as floating islet cell clusters (ICC). NL and DS ICC exhibited similar expansion rates. Scale bar: 100 μm
(B) β cells from fetal pancreas (I) and ICC (II) express insulin (red) and glucagon (green). Scale bar: 100 μm
(C) Mitochondria visualized in an insulin-positive cell (ins, arrows) with anti-cytochorome C IF (cyt C). Scale bar: 10 μm
(D) Mitochondria were stained in β cells as described in panel C. Note the increase in fragmented mitochondria in DS ICCs and in NL ICC exposed to the electron transport chain uncoupler FCCP (NL+ FCCP). Scale bar: 10 μm
(E) Colocalization of insulin and IAPP (amylin) in ICC β cells. Scale bar: 10 μm
(F) A11 imunoreactivity in DS ICCs. Sections of NL and DS ICC were labeled with antibody A11, which recognizes IAPP oligomers. Note the increase in A11 staining in DS β cells (arrows). Nuclei were stained with DAPI. Scale bar: 10 μm
(G) Reduced basal insulin secretion in DS ICCs. Insulin secretion was measured in ICC conditioned medium. Note the small but significant increase in insulin secretion in DS ICC treated with 50 μM trolox and 5 mM creatine)(DS cre tx). *p<0.05 and **p<0.01
(H) Higher proinsulin secretion in DS ICC. Note the marked increase in proinsulin levels in CM of DS ICC. Combined trolox/creatine treatment reduced proinsulin secretion in DS ICC. *p<0.05 and **p<0.01
Statistics: (G) and (H), by one way ANOVA followed by Tukey HSD test. (G) and (H) values are the mean ± SD, n=5 independent experiments.

