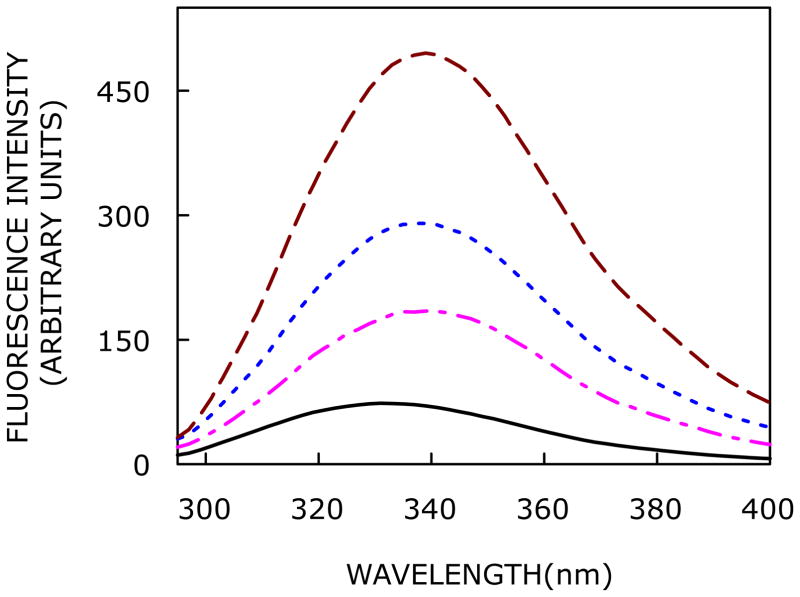
FIGURE 3.
Effect of increasing hydration on fluorescence emission spectra of the CXCR1 N-domain peptide in AOT/isooctane reverse micelles. Fluorescence emission spectra are shown as a function of [water]/[surfactant] molar ratio (w0) in order of increasing intensity corresponding to w0 = 3 (black,—), 10 (magenta, — - —), 15 (blue, ····), and 20 (red, ----). The excitation wavelength used was 280 nm. All the other conditions are as in Figure 2. See Experimental Section for more details.

