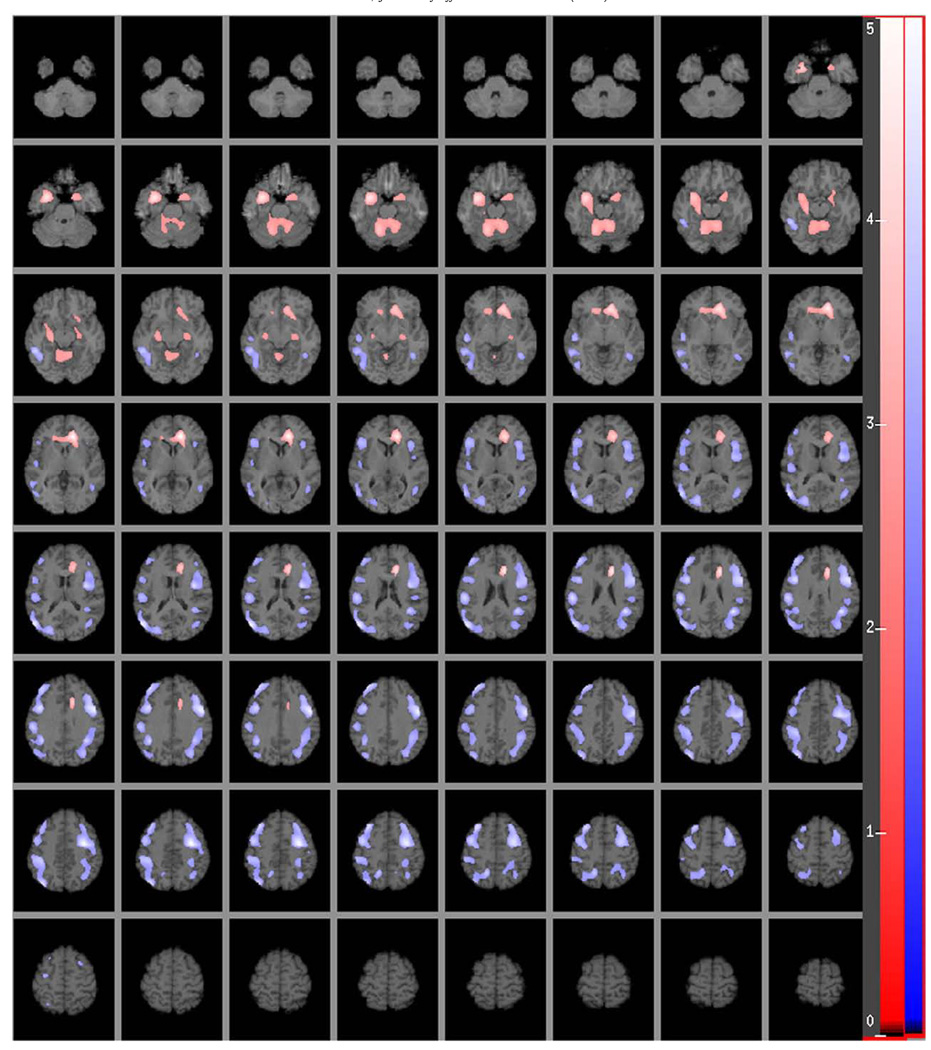
Fig. 2.
Relative regional cerebral metabolic rate for glucose (rCMRglu) correlation with the residuals of the Beck Depression Inventory (BDI) scores while controlling for the variance explained by the Hamilton Depression Rating Scale (HDRS). The color scales in the figure indicate the strength (t score) of the correlation (t score maps are overlaid on a series of transaxial slices (2 mm apart) of a coregistered MRI scan from ~38 mm below to ~72 mm above a line connecting the anterior and posterior commissure). Red to light red regions are uniquely positively correlated with BDI total score residuals, dark to light blue regions are uniquely negatively correlated with BDI total score residuals. (For interpretation of the references to color in this figure legend, the reader is referred to the web version of this article.)

