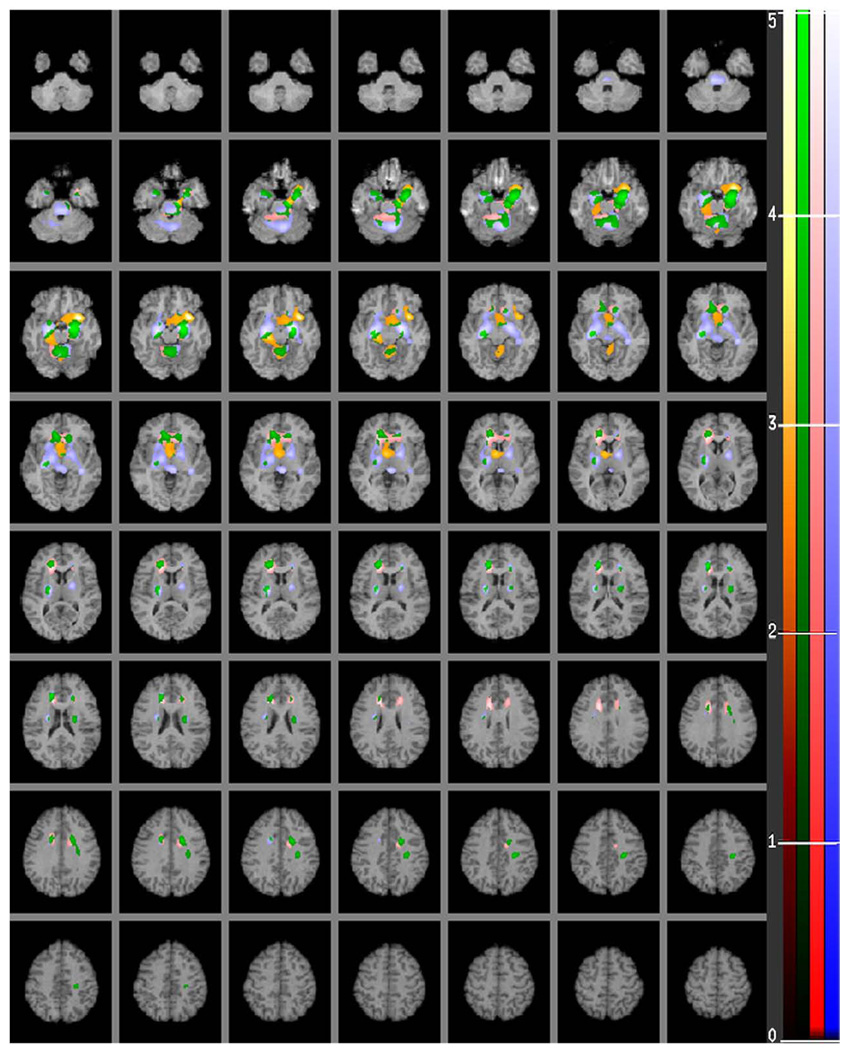
Fig. 4.
A human brain map of positive correlations of relative regional glucose metabolic rate (rCMRglu) in major depression with severity of depression as measured by factors 1, 2 and 3 derived from the Beck Depression Inventory (BDI). The color scales in the figure indicate the strength (t score) of the correlation (t score maps are overlaid on a series of transaxial slices (2 mm apart) of a coregistered MRI scan from 38 mm below to 72 mm above a line connecting the anterior and posterior commissure). Red to light red regions are uniquely positively correlated with Subjective Depression, brown to light orange regions are uniquely positively correlated with Self-Blame, blue to light blue regions are uniquely positively correlated with Somatic Complaint factor and green to light green colored areas depict regions that correlate with factors 1, 2 and/or 3. (For interpretation of the references to color in this figure legend, the reader is referred to the web version of this article.)

