Figure 3.
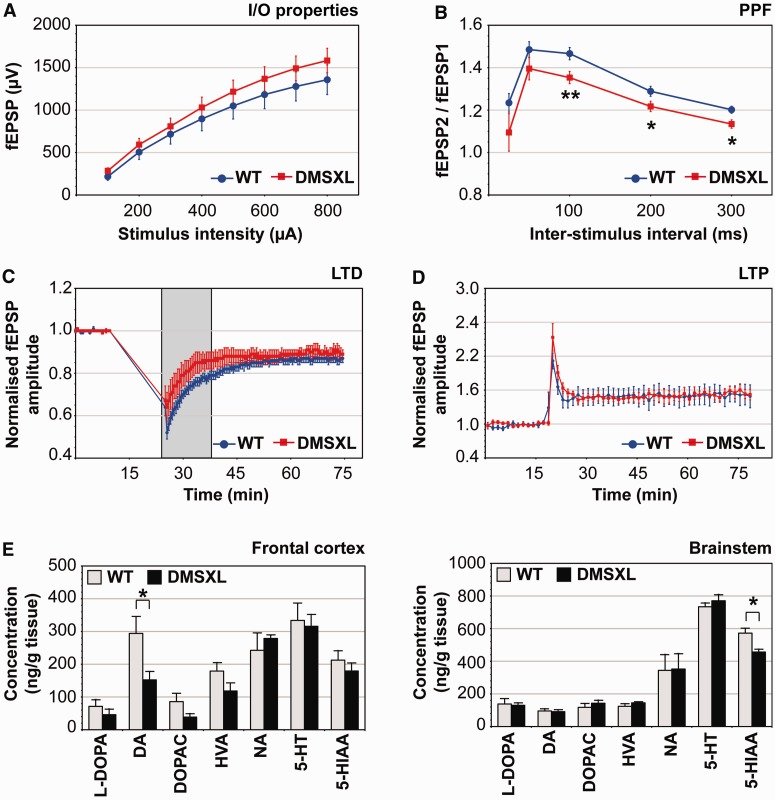
DMSXL mice exhibit deficits in short-term synaptic plasticity and changes in neurochemical levels. (A) Electrophysiological profiling of DMSXL mice and age-matched control mice. Input/output (I/O) characteristics in the CA1 region. Mean value of field excitatory post-synaptic potentials (fEPSP) (±SEM) is expressed as a function of stimulation intensity. (B) Paired-pulse facilitation (PPF) in the CA1 region. The mean ratio of the second peak compared with the first one (fEPSP2/fEPSP1, ±SEM) is expressed as a function of the interstimulus interval. Paired-pulse facilitation values were significantly lower in DMSXL hippocampal slices (repeated measures two-way ANOVA). The difference between genotypes was more pronounced for interstimulus intervals of 100, 200 and 300 ms. (C) Long-term depression (LTD) in the CA1 region. Mean value of normalized field excitatory post-synaptic potentials amplitude (±SEM) is expressed as a function of time. Long-term depression amplitude was slightly lower in DMSXL slices, shortly after low frequency stimulation (grey box), but overall long-term depression amplitude was not significantly different between DMSXL and wild-type mice. (D) Long-term potentiation (LTP) in the CA1 region. Mean value of normalized field excitatory postsynaptic potentials amplitude (±SEM) is expressed as a function of time. Long-term potentiation did not significantly differ between DMSXL and wild-type mice. Input/output, paired-pulse facilitation and long-term depression data correspond to values averaged from 16 independent slices prepared from DMSXL (n = 5) and wild-type mice (n = 5). Long-term potentiation data correspond to values averaged from 10 independent slices prepared from four DMSXL (n = 4) and five independent slices from three wild-type mice (n = 3). (E) Quantification of neurochemicals in the brain of DMSXL (n = 5) and wild-type control mice (n = 5) at age 4 months. Average concentration (±SEM) of l-3,4-dihydroxyphenylalanine (L-DOPA), dopamine (DA), 3,4-dihydroxyphenylacetic acid (DOPAC), homovanillic acid (HVA), noradrenaline (NA), serotonin (5-HT) and 5-hydroxyindoleacetic acid (5-HIAA) are plotted for frontal cortex and brainstem. *P < 0.05, **P < 0.01.

