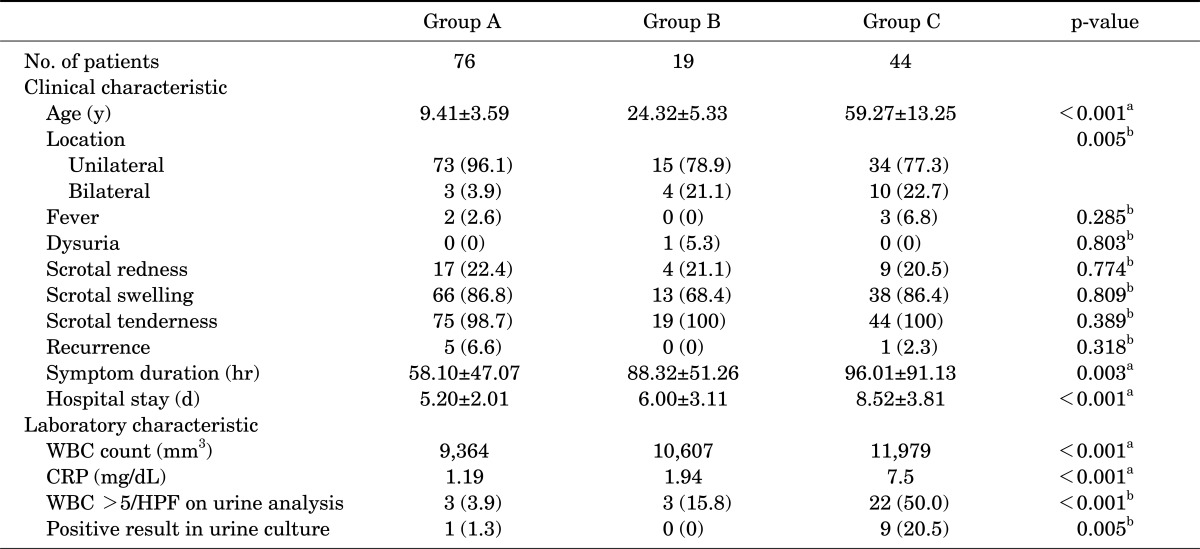
TABLE 1.
Clinical and laboratory characteristics of acute epididymitis in all patients

Values are presented as mean±standard deviation or number (%).
WBC, white blood cell; CRP, C reactive protein; HPF, high power field.
a:By one-way analysis of variance. b:Chi-square test.
