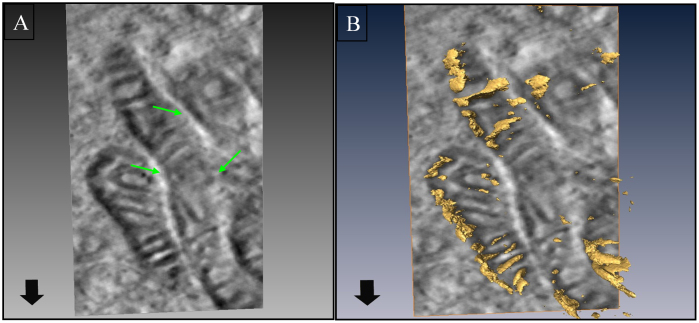
Figure 2. Mitochondrial clustering in cells infected with H37Rv imaged by electron tomography.
Panel A shows clustering of mitochondria in H37Rv infected cells. Inter-mitochondrial fusion of (shown by arrows) is clearly evident, suggesting an enhanced interaction between the individual mitochondria. A representative 3D reconstruction of the mitochondria from tomography data sets showing breaches in the mitochondrial cell wall and cristae (arrow) is shown in panel B.

