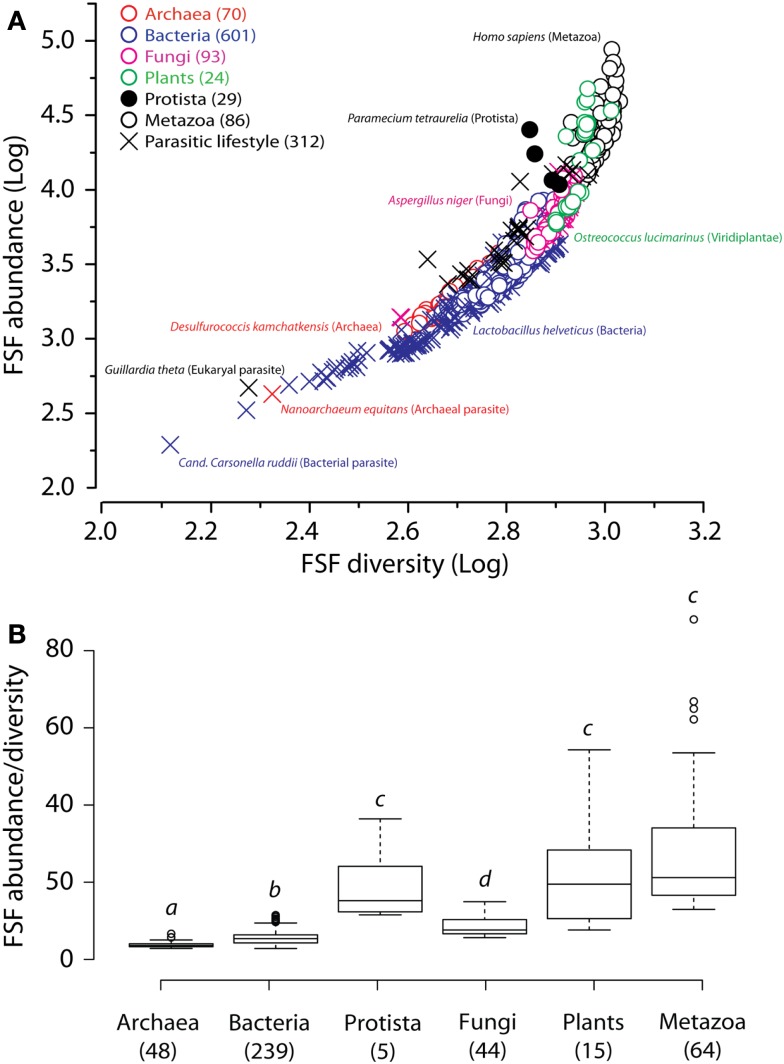
Figure 8.
Plots of FSF use (diversity) versus FSF reuse (abundance). (A) Plot of FSF use and reuse in the proteomes of the entire set of 903 organisms. (B) Box plots of the ratios of FSF reuse to FSF use in the proteomes of 415 free-living organisms of the six kingdoms. The ratio of 1 would imply that every FSF is found exactly once in the entire genome, which is why all numbers on the ordinate are greater than 1. Numbers in parenthesis indicate total number of proteomes studied for each group. Horizontal lines within each distribution indicate group median values. Outliers are indicated by hollow circles for Archaea [Methanospirillum hungatei (ratio = 5.7), Methanosarcina barkeri (5.7), Methanosarcina acetivorans (6.7)], Bacteria [Saccharopolyspora erythaea (10.0), Streptomyces griseus (10.0), Streptomyces avermitilis (10.2), Streptomyces coelicolor (10.3), Solibacter urisatus (10.6), Rhodoccus sp. (11.0), Burkholderia xenovorans (11.1), and Sorangium cellulosum (11.5)], and Metazoa [Homo sapiens (62.2), Monodelphis domestica (65.0), Branchiostoma floridae (66.9), Takifugu rubripes (88.1)]. Raw data was transformed by its reciprocal to meet the assumption of normality for one-way ANOVA. Welch’s correction was applied to protect from heteroscedastic variances (Welch, 1938) and Games–Howell multiple comparison test (Games and Howell, 1976) was used to evaluate significant differences among individual groups at P < 0.02 (indicated by different letter heading box plots).

