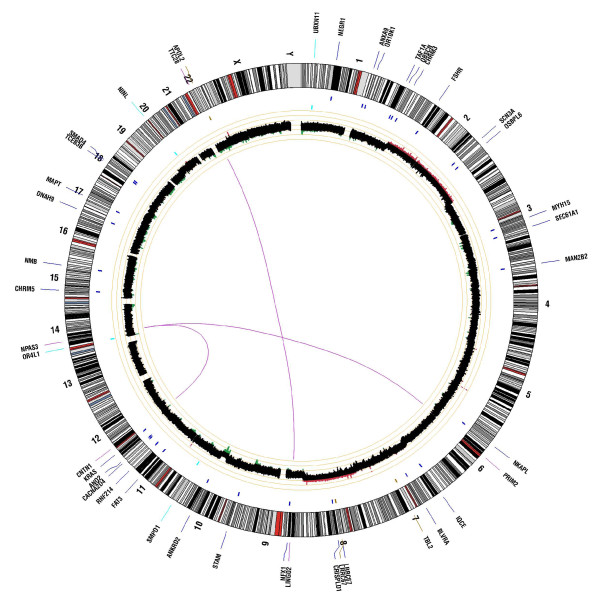
Figure 1.
Circos plot summarizing somatic events contained within pancreatic tumor of the ampulla of Vater. The outer ring shows gene symbols for those genes somatically altered in the tumor relative to their map position against the human genome chromosome karyotype. Blue tick marks denote genes containing nonsynonymous point mutations. Cyan tick marks denote genes containing coding indels. Magenta tick marks represent discordant read pairs supporting putative translocation events and those genes involved in breakpoints. The inner ring represents somatic copy number events with regions of gain shown in red and regions of loss shown in green, with brighter colors denoting higher degrees of gain or loss. Magenta lines in the center represent breakpoint regions for translocation events.

