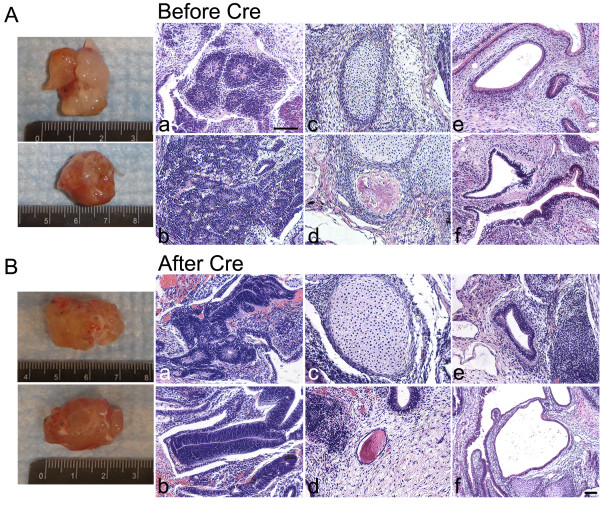
Figure 3.
Histological analysis of teratomas. Images of removed teratomas from mice are shown on the left of the image panels. (A) Multi-differentiated tissues derived from SCAP iPSCs (passage (p)11) before Cre-excision. (B) Teratomas from SCAP iPSCs (p10) after Cre-excision. (A & B) (a,b) mainly neural tissues, neural rosettes (ectoderm); (c) mainly cartilage (mesoderm); (d) bone tissue (mesoderm); (e,f) mainly glandular epithelium and endodermal tissues. (scale bar: 100 μm for all histologic images. Except Bf, all histologic images use the scale bar in Ba). iPSCs, induced pluripotent stem cells; SCAP, stem cells from apical papilla.

