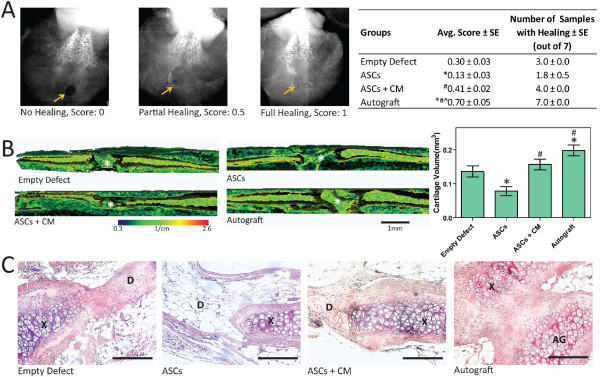
Figure 6.

Effects of adipose stem cells (ASCs) on cartilage regeneration. (A) Radiographic scoring with arrows highlighting the defect (n = 4 blinded scoring averages ± SE). *P < 0.05 vs. empty defect; #P < 0.05 vs. ASCs; ^P < 0.05 vs. ASC + chondrogenic medium, CM). (B) Three-dimensional EPIC-micro computer tomography (μCT) images of xiphoids with *marking the defect and calculated cartilage volume within defects (n = 7 ± SE). *P < 0.05 vs. empty defect; #P < 0.05 vs. ASCs. (C) Representative H&E staining. Bar represents 100 μm at 20 × magnification (D = defect, × = xiphoid, AG = autograft).
