
Figure 5.
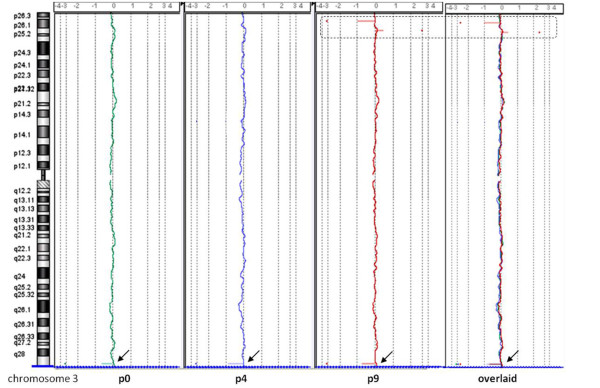
Example of array-CGH profiles of human bone marrow stem cells (hBM-MSCs) at three different passages of culture. Example of chromosome 3 from donor 8 in three overlapping experiments (P0, green line; P4, blue line; P9, red line): the profiles were almost overlapping (black arrow, a common copy-number variation (CNV), but P9 showed some exclusive CNVs (dotted rectangle).