
Figure 3.
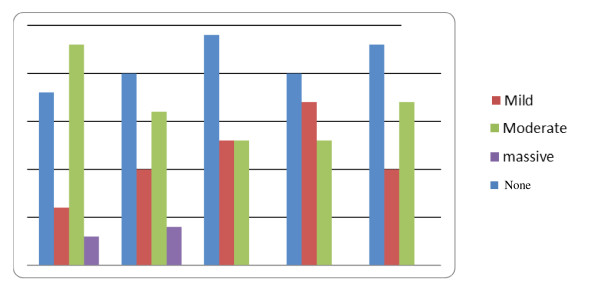
Progress of the degree of ascites in group (I) during the follow-up period. Y axis represents the percentage of patients; X-axis represents the time of the follow-up period, and the figure represents the change of the degree of ascites during the follow-up period.