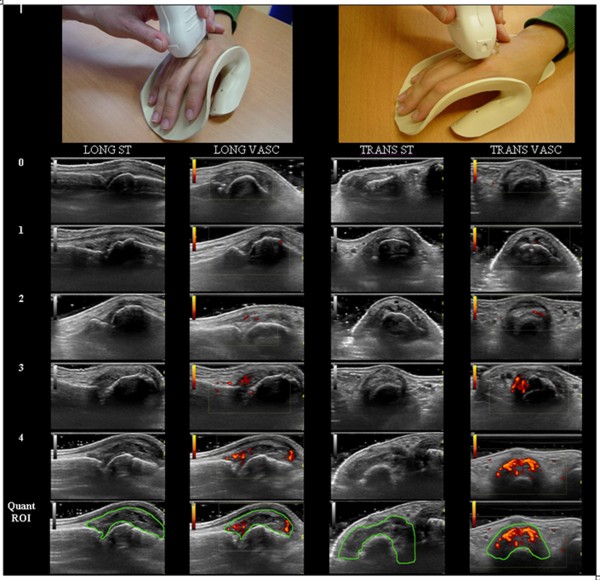
Figure 1.
Illustration of ultrasonographic scanning in the longitudinal and transverse plane using a splint to standardize image acquisition. The four columns contain the semi-quantitative scales with scores from 0 to 4: 0 representing the lack of PD signal and 4 being severe PD signal; 0 representing no synovial thickening and 4 being severe synovial thickening. The last row demonstrates the region of interest (ROI) for quantitative analysis. Images were cropped for clarity. LONG: longitudinal, TRANS: transverse, ST: synovial thickening, VASC: vascularity, Quant ROI: region of interest for quantitative analysis, STA: synovial thickness area, PDA: power Doppler area.

