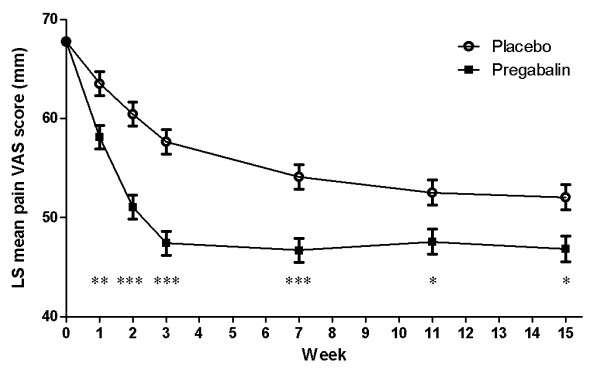
Figure 4.

LS mean pain VAS score. Weekly assessment analyses based on the results of the MMRM analysis with weekly mean VAS score. Scores range from 0 to 100 with higher scores indicating increased pain. Mean value (± SE) shown for each time point, where *P ≤0.025, **P ≤0.001 and ***P ≤0.0001 for each treatment time point compared with placebo.
