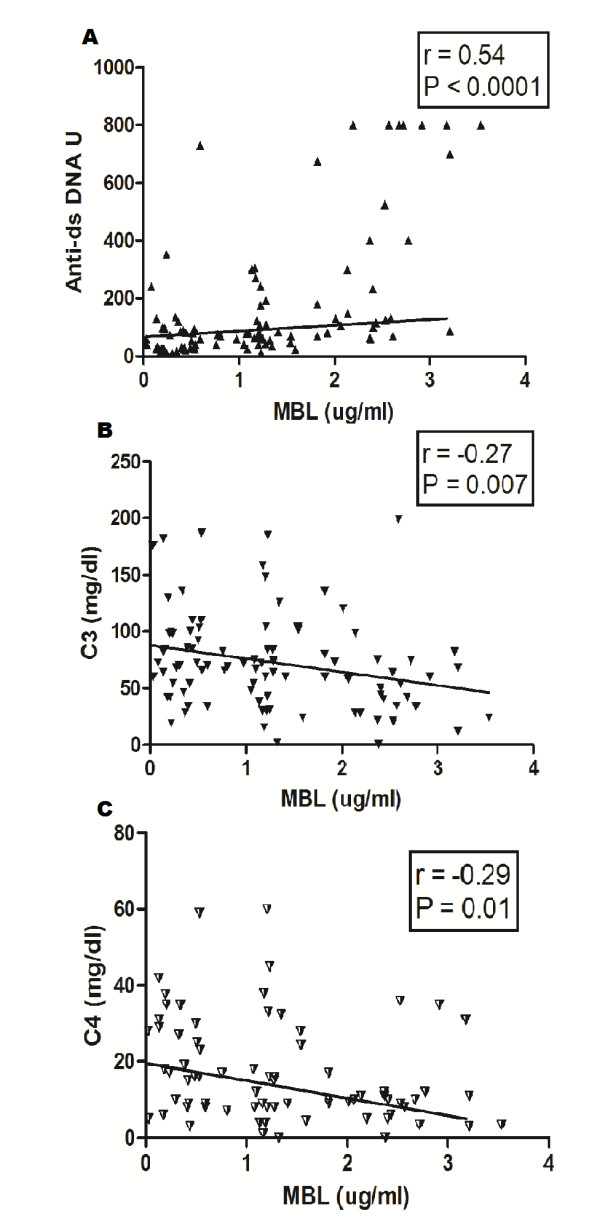
Figure 3.

Correlation of plasma mannose binding lectin (MBL) levels with anti-dsDNA, and complement components C3 and C4. Plasma MBL levels correlated positively with anti-dsDNA (A) and negatively with plasma levels of C3 (B) and C4 (C). Dots represent individual samples. Correlation analysis was performed using the Spearman correlation coefficient. P < 0.05 was considered significant.
