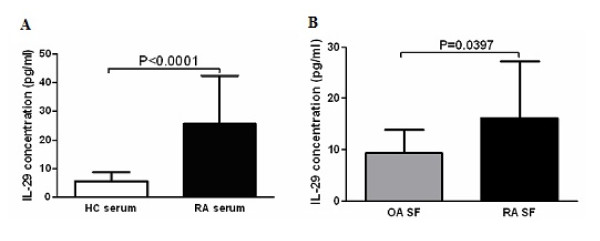
Figure 2.

Increased expression of IL-29 in rheumatoid arthritis (RA) serum and synovial fluid (SF) compared to in healthy control (HC) serum and osteoarthritis (OA) SF. Levels of IL-29 in serum (A) from RA (n = 54) and HC (n = 60), and SF (B) from RA (n = 20) and OA (n = 20) were quantified by ELISA. Values are the mean ± SD. Actual P values are shown in the graph.
