
Figure 4.
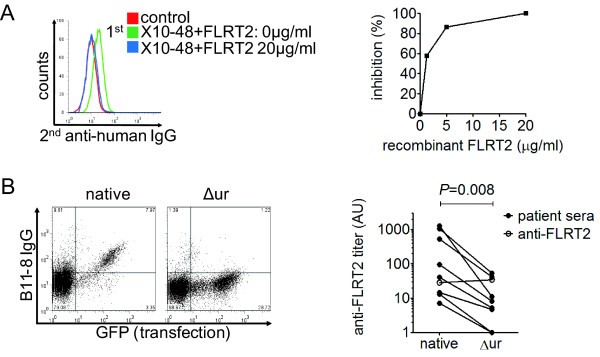
Inhibition test and epitope mapping. (A) Inhibition tests of binding activities to HUVECs were performed by using IgG from healthy donor (control) and anti-FLRT2 sera (X10-48) with soluble FLRT2 at the indicated concentrations. (B) Changes in binding activity to FLRT2 lacking the unique region (Δur) compared with native FLRT2 were analyzed by using anti-FLRT2 sera. Representative dot plot (left) and a summary of changes in each patient (right) are shown. Open circles show the binding activity to the intracellular FLRT2 domain.