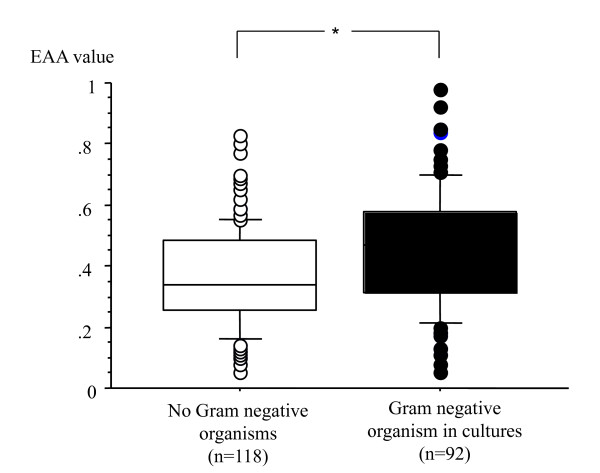
Figure 1.
Endotoxin Activity Assay (EAA) values in patients with Gram-negaitve infection and no infections. Patients with no Gram-negative organisms in any culture (n = 118) (white square boxes) and with Gram-negative organisms in some cultures (n = 92) (black square boxes). The horizontal bar in each box indicates the median value, and the box indicates the interquartile ranges (IQRs). The vertical lines indicate 1.5 times the IQR. All values outside these lines are shown as black or white spots. *P < 0.0001.

