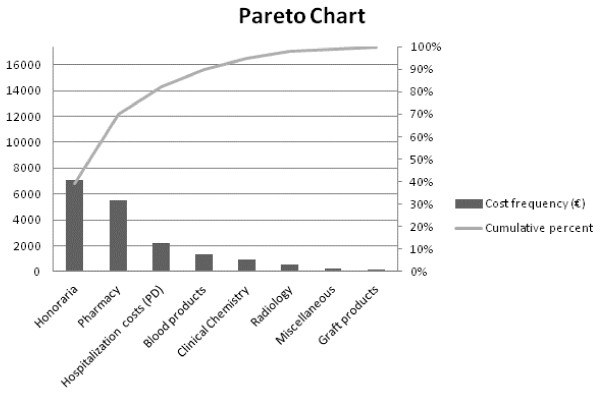
Figure 2.

Pareto chart of the costs for the total EPaNIC trial population. The histogram depicts the relative size of each cost category in comparison with the total cost. The line graph shows their cumulative contribution. Important cost drivers for total hospital stay in the EPaNIC trial population are highlighted. EPaNIC, Impact of Early Parenteral Nutrition completing enteral nutrition In Critical illness; PD, per diem.
