
Figure 2.
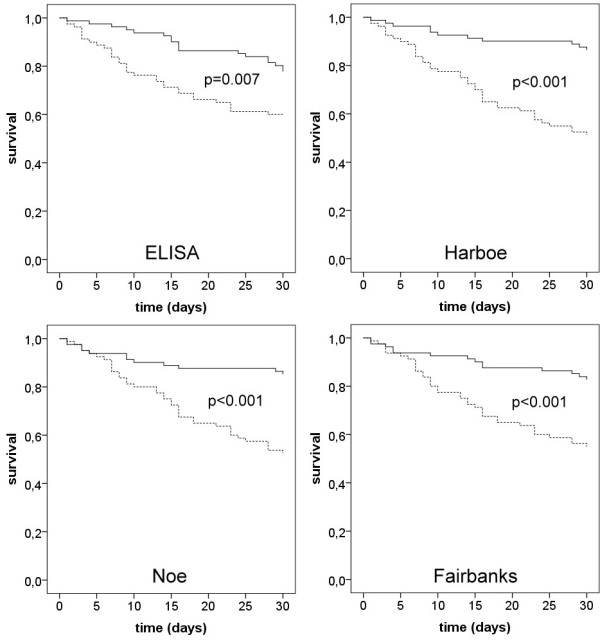
Kaplan-Meier analyses of 30-day survival of patients with severe sepsis demonstrating the effect of high and low free hemoglobin concentrations as determined by four methods. Four sets of Kaplan-Meier curves are shown, as analysis was performed with each of the four methods used for the determination of free hemoglobin. The continuous lines show the survival of patients with free hemoglobin concentrations lower than the median, and the dotted lines show the survival when free hemoglobin concentration was higher than the median of all patients with sepsis. Significance levels for the log rank test are given in the figure. Methods used to measure free hemoglobin were ELISA and the spectrophotometric methods of Harboe [13], Noe [14] and Fairbanks [15].