
Figure 1.
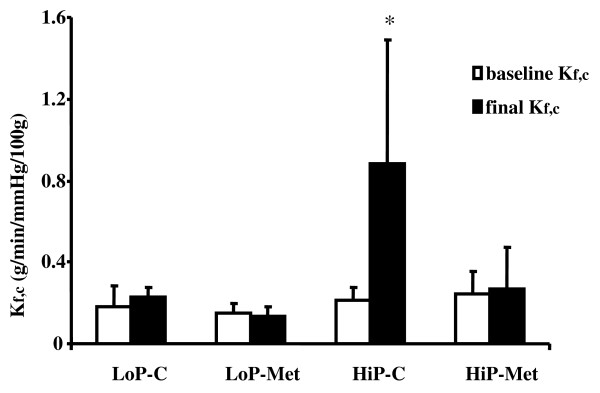
Ultrafiltration coefficient measured at baseline (baseline Kf,c) and after the ventilation protocol (final Kf,c). Results are presented as means ± standard deviation; n = 7 animals per HiP group and 5 animals per LoP group. *P < 0.05 for HiP-C group vs. all other groups. LoP-C: low pressure-no metformin; LoP-Met: low pressure-metformin; HiP-C: high pressure-no metformin; HiP-Met: high pressure-metformin.