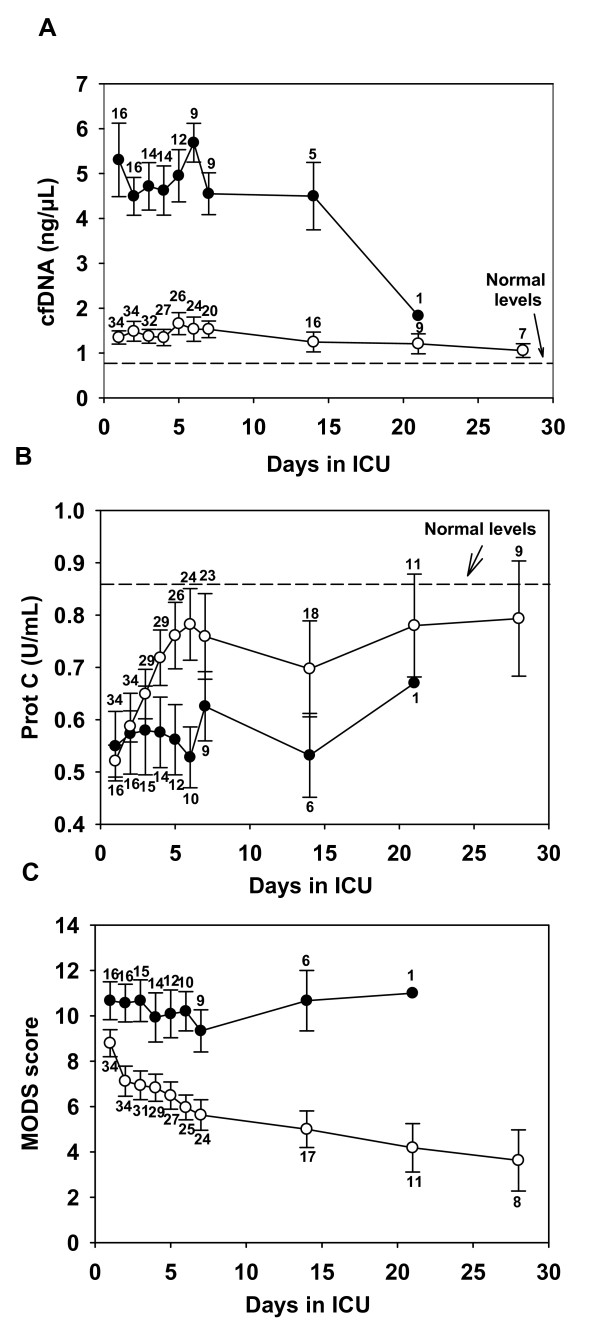
Figure 2.
Temporal changes in levels of cfDNA (A), PC (B), and MOD score (C) in 50 patients with severe sepsis. Survivors are shown by white circles (o), and nonsurvivors are shown by black circles (●). The number of patients at each time point (for which cfDNA, PC, or MODS values are available) is indicated in each graph. Data are shown as the mean ± SEM. The mean levels of cfDNA and PC in healthy volunteers (n = 14) is shown by the arrows.

