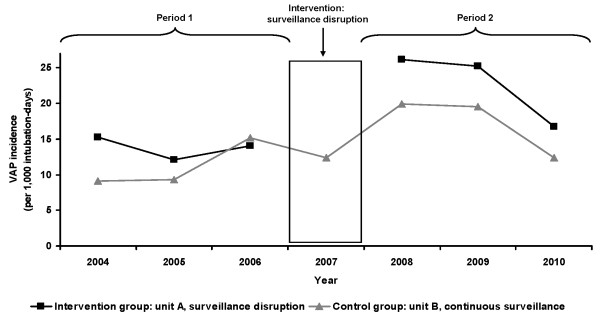
Figure 1.

Trend of ventilator-associated pneumonia incidence in ICU, Edouard Herriot Hospital, Lyon (France), 2004-2010. NOTE: The intervention group was unit A with surveillance disruption in 2007, the control group was unit B with continuous surveillance. Period 1 (pre-test period) comprised patients hospitalized during 2004 to 2006, period 2 (post-test period) involved patients hospitalized during 2008 to 2010. During period 1, no difference in the VAP attack rate (number of VAPs per 100 intubated patients) was observed between units A and B (P = 0.43). During period 2, the VAP attack rate was higher in unit A compared to unit B (P = 0.002). In unit A, the VAP attack rate increased between periods 1 and 2 (P <0.001). In unit B, the VAP attack rate did not change between periods 1 and 2 (P = 0.17).
