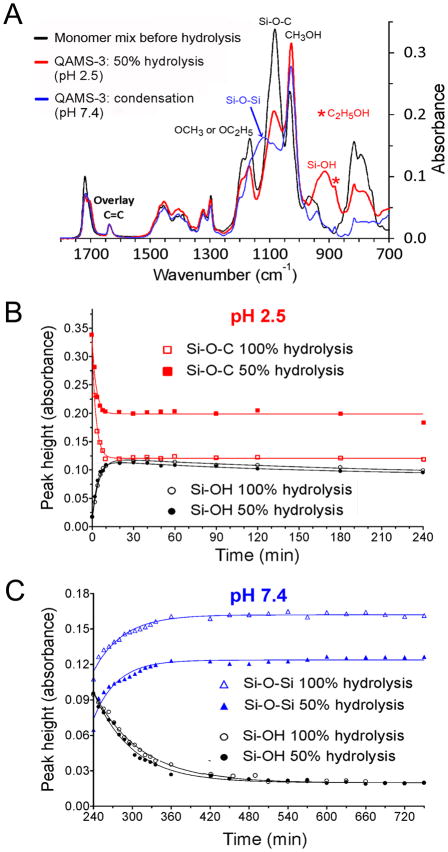
Figure 2.
Hydrolysis and condensation kinetics of QAMS-3 monitored by ATR-FTIR. A. Infrared spectra of the monomer mix for preparing QAMS-3, after partial hydrolysis of the monomer mix at pH 2.5 and after condensation at pH 7.4. B. Hydrolysis kinetics of completely- and partially-hydrolyzed QAMS-3 at pH 2.5. Plots represent changes in peak heights of the Si-O-C band at 1082 cm−1 and Si-OH band at 914 cm−1. C. Condensation kinetics of completely- and partially-hydrolyzed QAMS-3 at pH 7.4. Plots represent changes in peak heights of the Si-O-Si band at 1117 cm−1 and Si-OH band at 914 cm−1.

