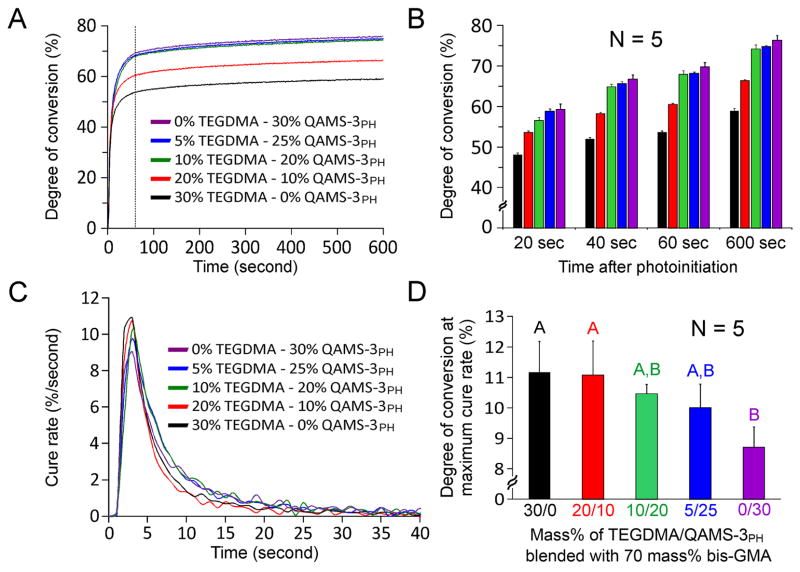
Figure 3.
Kinetics of monomer conversion. A. Conversion values increased as the concentration of TEGDMA diluent was reduced and replaced by equivilent amounts of QAMS-3PH. Dotted vertical line at 60 seconds represents termination of light curing. B. Conversion values at specific time points among the five comonomer blends. This figure shows the increase in degree of monomer conversion at each time point with respect to increasing QAMS-3PH concentration. From the cure rate (C), it can be seen that there were two distinct phases in the polymerization process: an auto-accleration phase and an auto-deceleration phase. Curing of the 5 comonomer blends peaks at a maximum rate from 9–11% per second. This peaks occurs very eary in the conversion process, that is, within the first 3–4 seconds. D. Degree of conversion at maximum cure rate. Groups that are labeled with the same upper case letters are not statistically significant (p > 0.05). A clear trend of decreasing conversion at maximal cure rate with respect to increasing QAMS-3PH concentration is evident for the materials tested.

