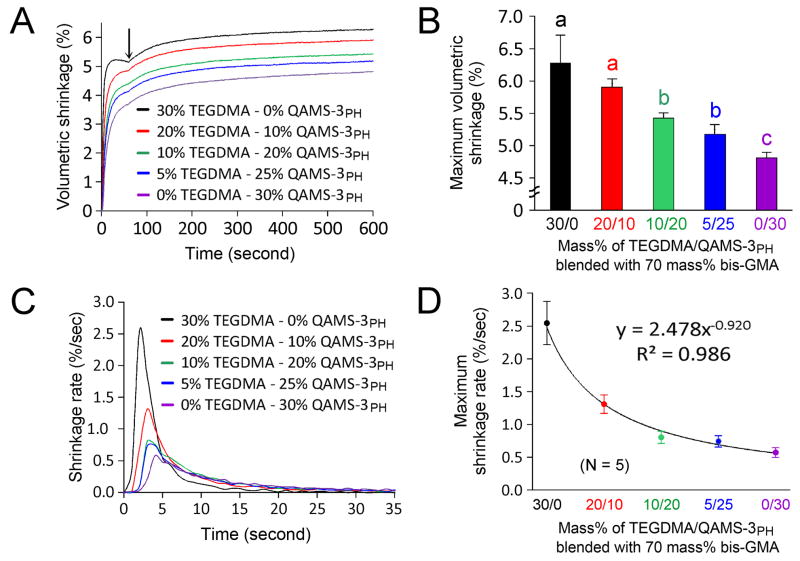
Figure 4.
Kinetics of polymerization shirnkage. A. The five bis-GMA comonomer blends all demonstrated polymerization shrinkage when exposed to visible light. With the exception of an initial expansion caused by the heat generated during light exposure (arrow), polymerization shrinkage continued to increase until a maximum shrinkage value was achieved for each rspective resin. B. Maximum volumetric shrinkage among the five comonomer blends. Groups that are labeled with the same low case letters are not statistically significant (p > 0.05). C. Changes in shrinkage rate with time. Similar to the conversion kinetcs in S-4A, two distinct phases in the polymerization process are evident, with the highest shrinkage rate occurring between 3–5 seconds before auto-decleration occurred. D. A powder regression model provides an excellent fit (adjusted R2 = 0.986; p < 0.01) for the relation between the maximum shrinkage rate and increases in QAMS-3PH concentration.

