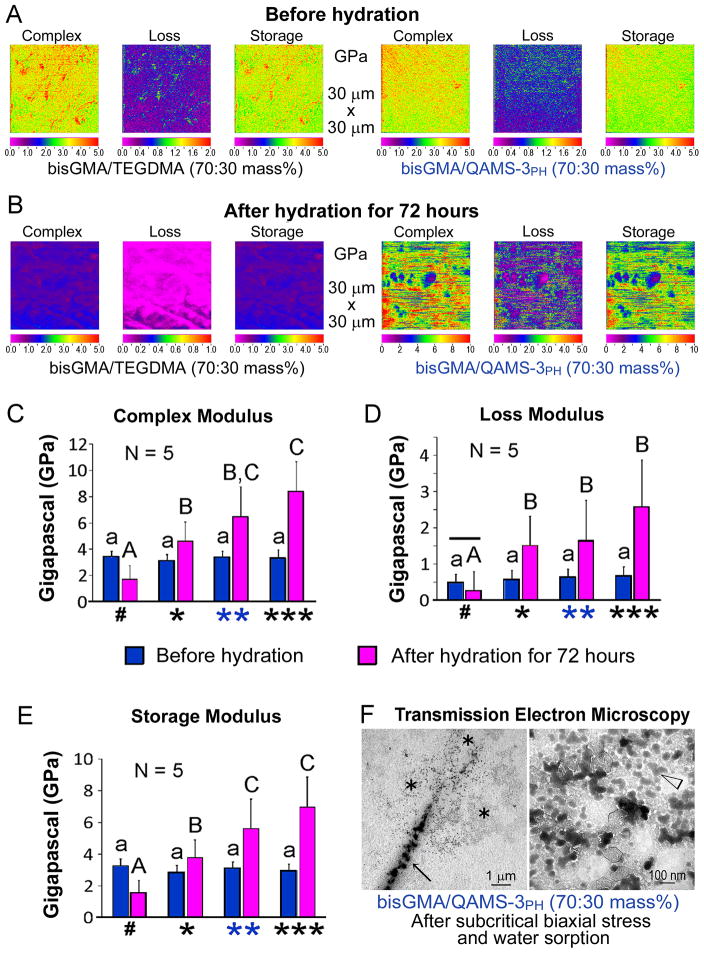
Figure 8.
Dynamic mechanical behavior (complex modulus, loss modulus and storage modulus) under dehydrated and hydrated conditions. A–B. Representative mechanical property maps of polymerized resins prepared from control bis-GMA/TEGDMA and experimental bis-GMA/QAMS-3PH (both 70:30 mass%) before (A) and after (B) hydration. Note difference in scale between the control and experimental resins in B. QAMS-3PH: methanol-solvated, partially-hydrolyzed QAMS-3. C–E. Complex modulus (C), loss modulus (D) and storage modulus (E) of the control and experimental groups. Group designations along the horizontal axis - #:bisGMA/TEGDMA (70:30 mass%); *:bisGMA/QAMS-3 monomer mix (70:30 mass%); **: bis-GMA/QAMS-3PH (70:30 mass%); ***: bis-GMA/QAMS-3PH (60:40 mass%). For each material property, same lower-case designations in “before hydration” groups denote no significant difference. Same upper-case designations in “after hydration” denote no significant difference. For each “resin composition”, horizontal bar over the two “hydration modes” denotes no-significant difference. F. Left: Transmission electron microscopy of phosphotungstic acid-stained, stressed-and-hydrated experimental resin (bis-GMA/QAMS-3PH, mass ratio:70:30) showing electron-dense phases (asterisks) deposited around a crack-tip (arrow). Right: High magnification of an asterisked region revealing an interconnecting network of probable organic modified silicate condensation products (arrowhead).

