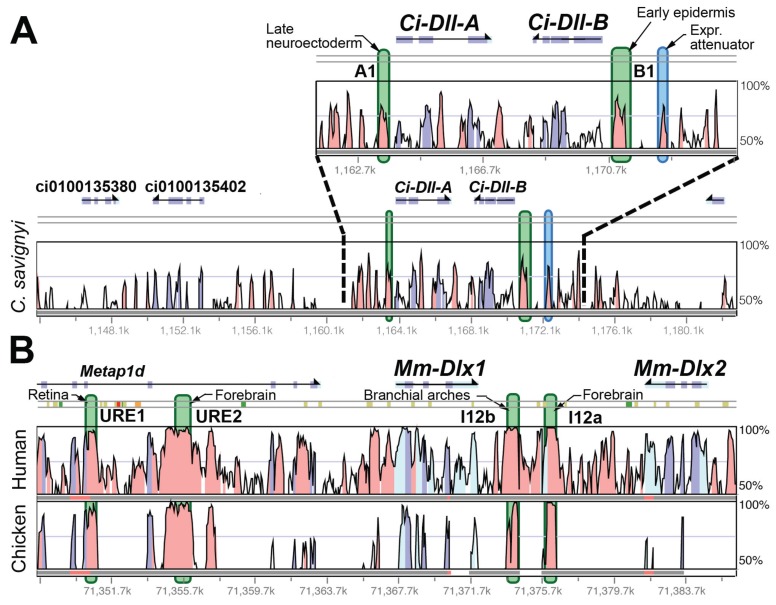
Fig. (5).
Graphical representations of sequence conservation and CRE locations for Dlx cluster genes in C. intestinalis and mouse. Plots constructed as in Fig. 3. The mouse Dlx1-2 cluster is used in comparison with the C. intestinalis DllA-B cluster, since there are more CRE data available for that cluster, although the orthology of the C. intestinalis cluster with respect to the three mouse Dlx clusters has not been able to be determined by phylogenetic means [31]. A) C. intestinalis Pax6 vs. C. savignyi genome. The region proximal to the TSSs is shown enlarged. B) Mouse Dlx1-2 cluster vs. chicken. (CREs: [37, 51, 52]).

