
Figure 3.
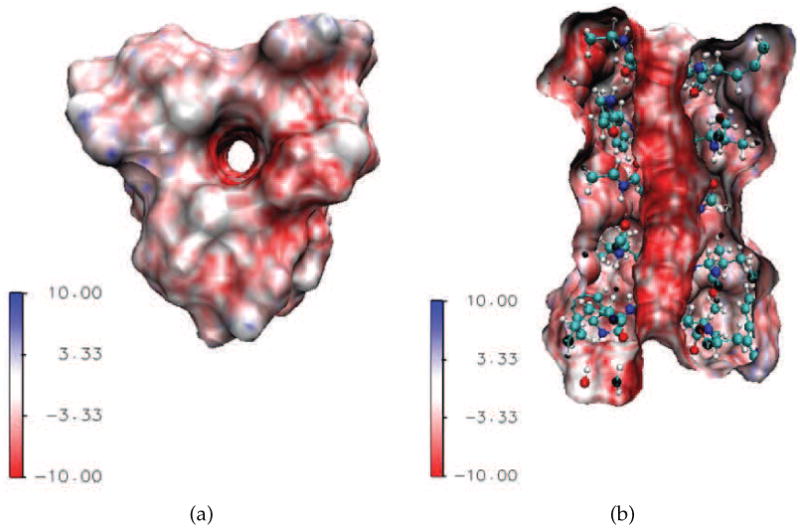
3D illustration of the Gramicidin A (GA) channel structure and surface electrostatic potential, with unit of kBT/q. The negative surface electrostatics as indicated by the intensive red color on the channel upper surface and inside the channel pore implies that the GA selects positive ions. (a) Top view of the GA channel; (b) Side view of the GA channel.