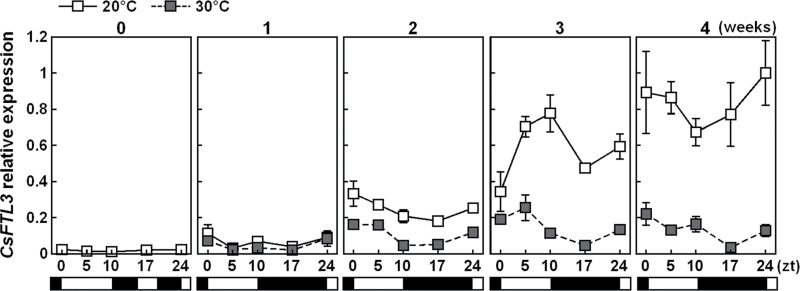
Fig. 4.
Expression analysis of CsFTL3 in the leaves of C. seticuspe by using quantitatitve real-time PCR. Plants were grown at 20 °C or 30 °C with a 10h photoperiod. The leaves were harvested every week. Open and filled horizontal bars represent light and dark periods, respectively. CsACT was used as an internal standard. Values are means ±SE (n=3).

