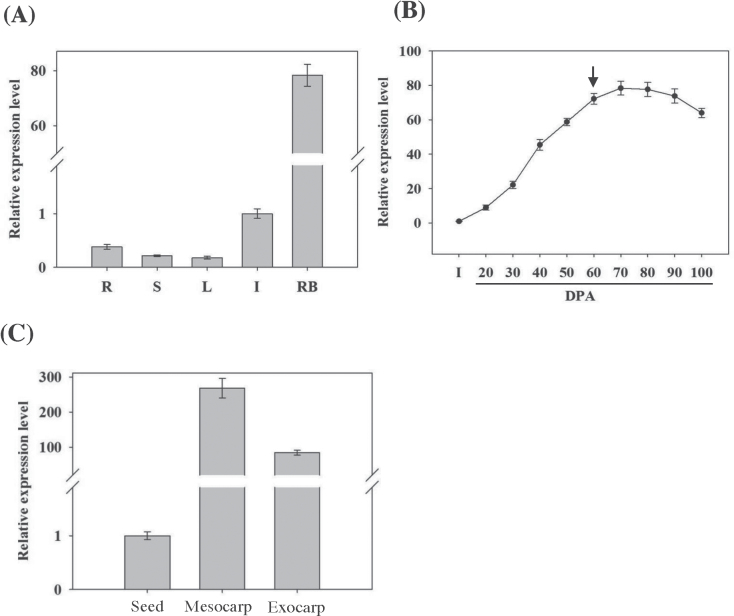
Fig. 3.
qRT-PCR analysis of VvCEB1 expression patterns in grapevine cv. Cabernet Sauvignon. (A) VvCEB1 expression in various grapevine organs: roots (R), stem (S), leaves (L), inflorescences (I), and ripening berries (RB) at 80 d p.a. Results are shown as means ±SD for three independent experiments. Gene expression was normalized against VvEF1γ expression. (B) VvCEB1 expression at different stages of berry development, from inflorescences (I) to mature berries at 100 d p.a. (DPA). The arrow indicates the veraison stage. Results are shown as means ±SD for four replicates from two independent experiments (carried out in the summer of 2006 and 2009). Gene expression was normalized against VvEF1γ. (C) VvCEB1 expression in different tissues from ripening berries at 80 d p.a. Results are shown as means ±SD for three independent experiments. Gene expression was normalized against VvEF1γ.

