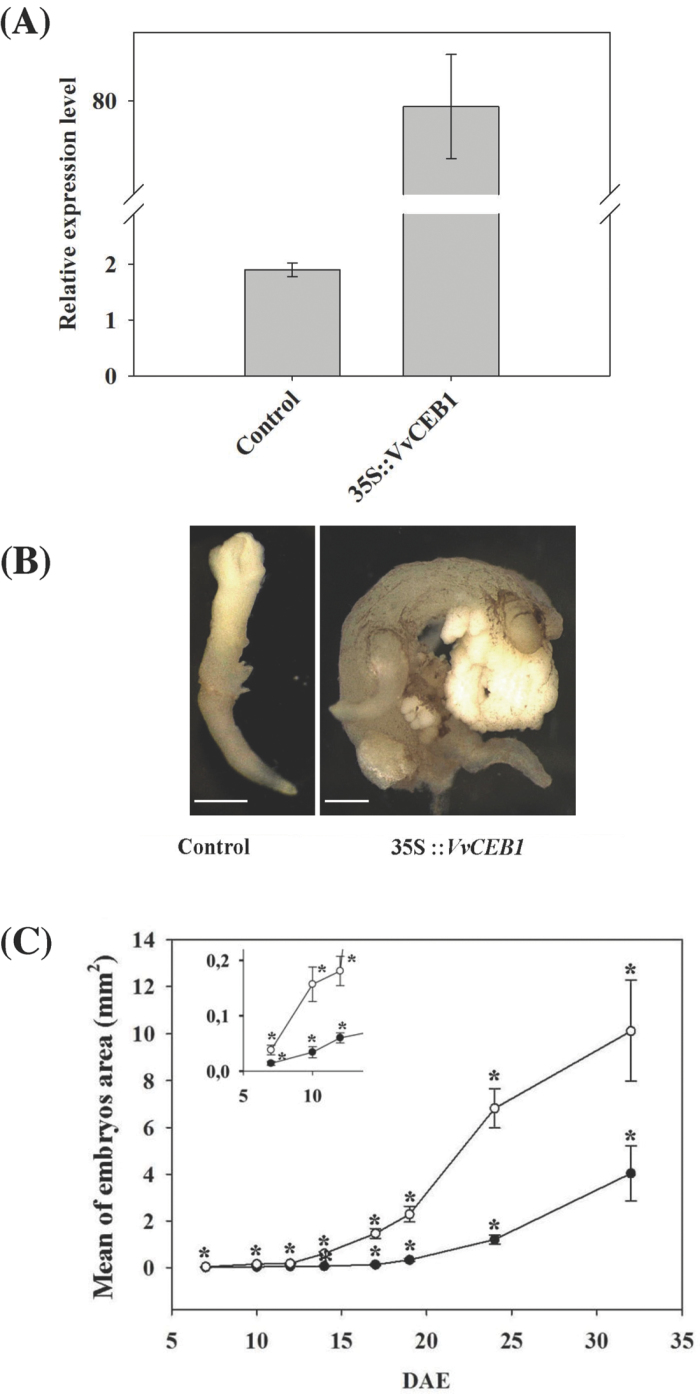
Fig. 5.
Overexpression of VvCEB1 strongly affects grape embryo development. (A) Relative expression level of VvCEB1 transcript accumulation in transgenic grape 41B embryos. The VvCEB1 transcript level was quantified by qRT-PCR in control (pFB8 empty vector) and VvCEB1-overexpressing (35S::VvCEB1) lines. These embryos were collected 7 d after initiation of embryogenesis. Gene expression was normalized against VvEF1γ. Data are means ±SD of three independent experiments. (B) Control (pFB8 empty vector) and VvCEB1-overexpressing (35S::VvCEB1) embryos lines were observed with a stereomicroscope 32 d after the initiation of embryogenesis. Bars, 1mm. (C) Embryos sizes were measured at different stages of 41B embryo development, from 7 to 32 d after initiation of embryogenesis (DAE), both for control (pFB8 empty vector, black circles) and VvCEB1-overexpressing (35S::VvCEB1, open circles) lines. Thirty embryos were measured for each developmental stage in both lines. Results are shown as means ±SD. Kruskal-Wallis one way analysis of variance on ranks was performed and asterisks indicate statistically significant differences between lines at the same time point (P<0.001).

