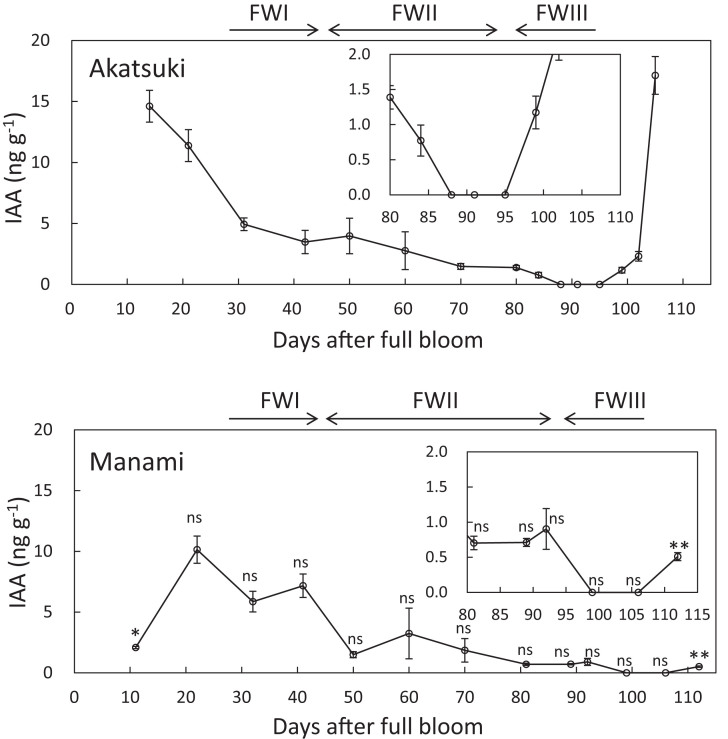
Fig. 2.
IAA concentrations of melting cultivar ‘Akatsuki’ and stony hard cultivar ‘Manami’. Insets show different scales of graphs. Horizontal arrows above the graphs indicate growth stages: FWI, cell division and enlargement; FWII, period of slow growth (pit hardening stage); FWIII, second period of exponential growth. Data are means ± SE of three individual experiments. Asterisks indicate statistically significant differences compared with ‘Akatsuki’ at a similar stage in development (days after full bloom) using Student’s t-test (*P < 0.05, **P < 0.01). ns indicates that there were no significant differences compared with ‘Akatsuki’.

