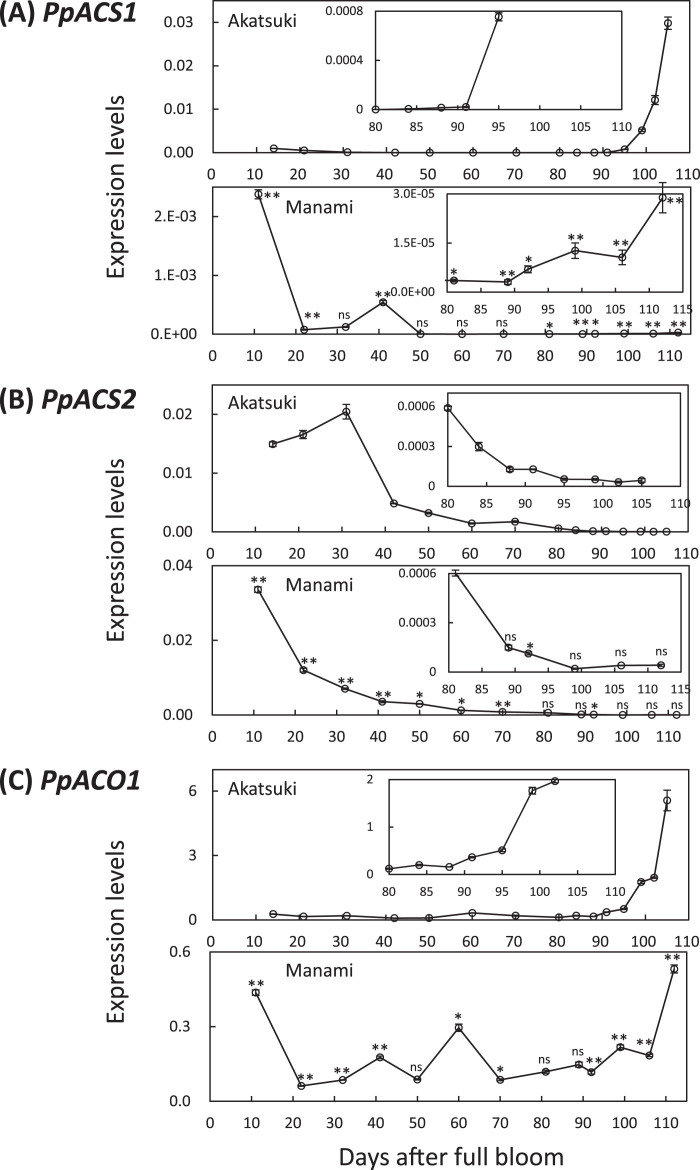
Fig. 4.
Relative transcript abundance of (A) PpACS1, (B) PpACS2 and (C) PpACO1, in ‘Akatsuki’ (upper) and in ‘Manami’ (lower). Insets show different scales of graphs. The steady-state levels were normalized to actin. Data are means ± SE of two individual experiments, each performed in triplicate. Asterisks indicate statistically significant differences compared with ‘Akatsuki’ at a similar stage in development (days after full bloom) using Student’s t-test (*P < 0.05, **P < 0.01). ns indicates that there were no significant differences compared with ‘Akatsuki’.

