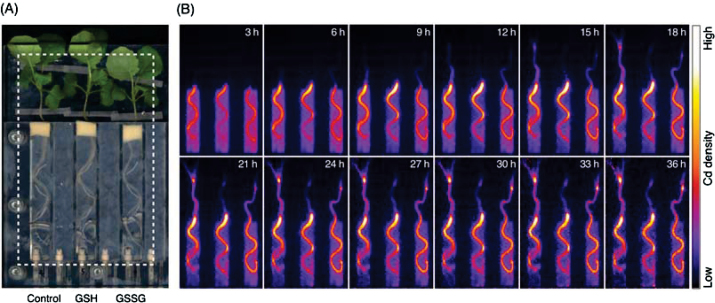
Fig. 4.
PETIS imaging of transport and accumulation of Cd in oilseed rape plants. (A) Field of view (rectangle) of a representative PETIS experiment. (B) Time series of PETIS images showing the 107Cd signal (0–36h) after decay correction. Each image shown is a composite of 45 original images collected every 4min. All plants are exposed to 107Cd in the root medium; plants on the centre and right were exposed additionally to GSH and GSSG, respectively.

