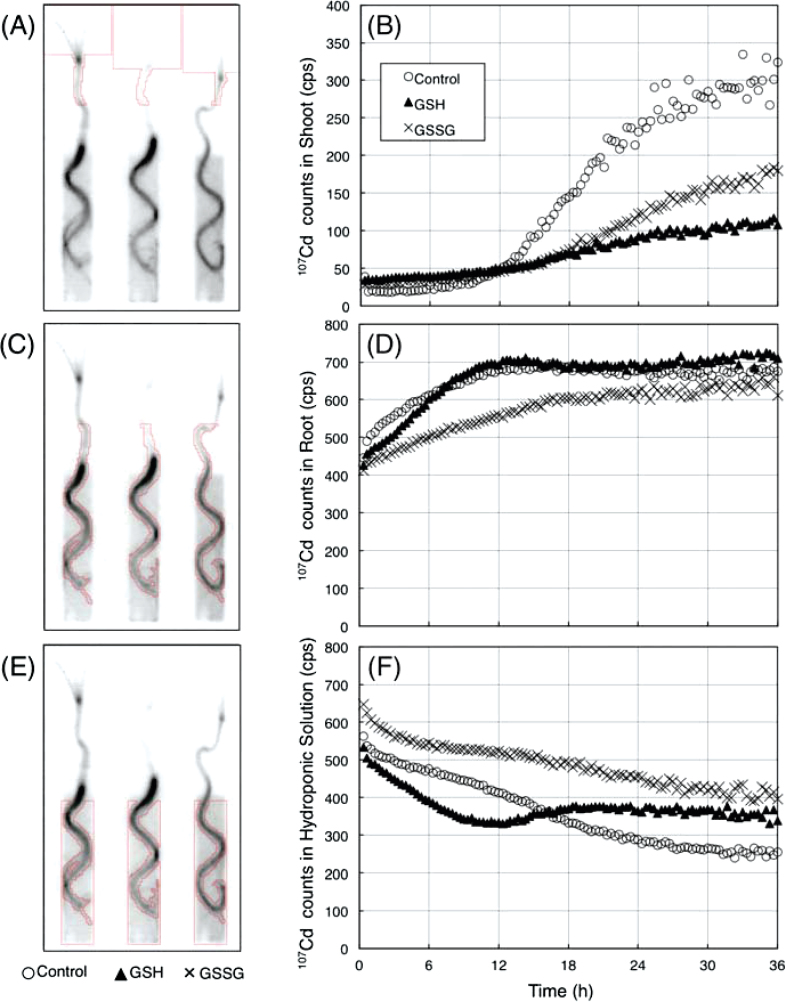
Fig. 5.
Time-course analyses of Cd dynamics in shoot, root, and solution: regions of interest (ROIs) for time-course analyses. (A, C, E) Red squares in each panel indicate ROI-1 (A, shoot), ROI-2 (C, root), and ROI-3 (E, solution). (B, D, F) Time courses of 107Cd signal in ROI-1 (B), ROI-2 (D), and ROI-3 (F). Each graph indicates the intensity of 107Cd signal after decay correction.

