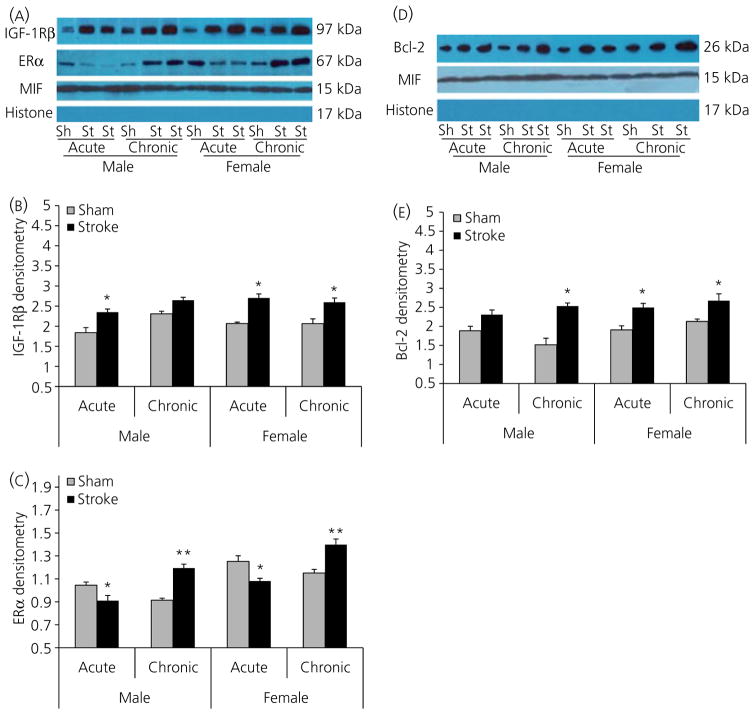
Fig. 7.
Western blots of inslulin-like growth factor (IGF)-1Rβ, oestrogen receptpr (ER)α and Bcl-2 in each group. (A) Expression of IGF-1Rβ and ERα in the cytosolic fraction of brain homogenates from E2-treated male and female mice 24 h after stroke onset. Migration inhibitory factor (MIF) was used as a loading control and Histone H3 analysis confirmed the lack of nuclear contamination. (B,C) The optical density of samples in (A) was expressed as the ratio of IGF-1Rβ (B) and ERα (C) bands to control bands (MIF). (B) *P < 0.05 versus sham groups. (C) *P < 0.05 versus acute sham groups; **P < 0.05 versus chronic sham groups. (D) Expression of Bcl-2 in the cytosolic fraction of brain homogenates from E2-treated male and female mice 24 h after stroke onset. MIF was used as a loading control and Histone H3 confirmed the lack of nuclear contamination. (E) The optical density of samples in (D) was expressed as the ratio of Bcl-2 bands to control bands (MIF). *P < 0.05 versus sham groups. Six stroke and sham brains were randomly aliquoted into three separate experiments for statistical analysis. Sh, sham; St, stroke.

