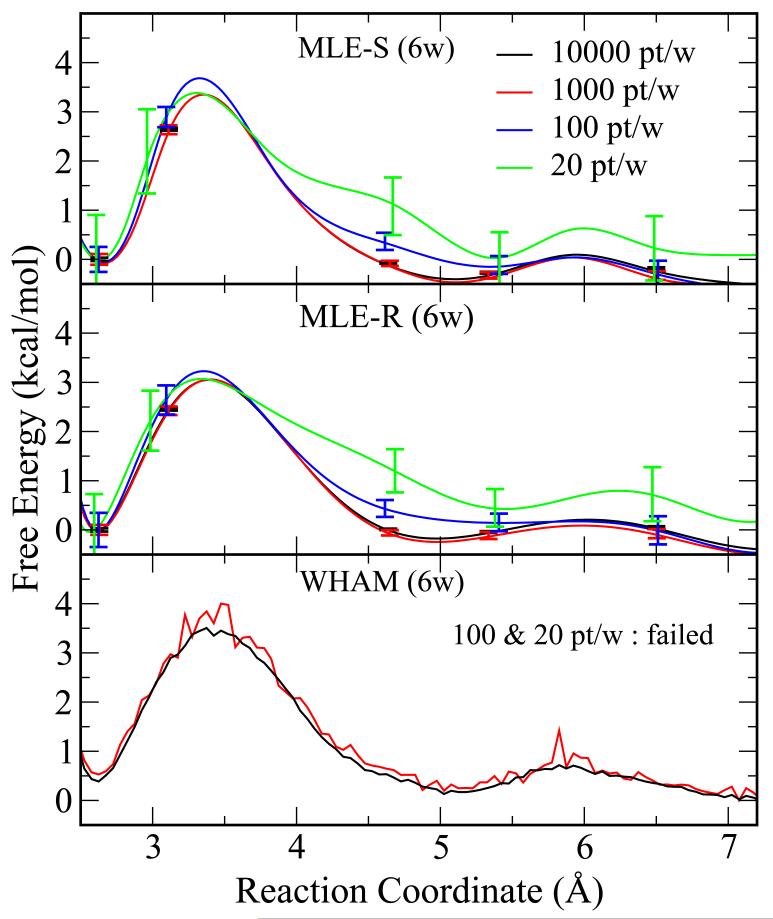
Figure 4.
The free energy profiles calculated with WHAM and VFEP for the Na+:Cl− pair from a 6-window umbrella sampling simulation with a weak biasing potential of 5 kcal/mol-Å2. The data points are reduced at different levels: 10000 pt/w (black), 1000 pt/w (red), and 100 pt/w (blue), and 20 pt/w. The error bars are bootstrap errors calculated from 100 random data sets with the same size. The upper panel and middle panel show the VFEP results with spline (MLE-S) and rational interpolation (MLE-R) functions, respectively, while the WHAM results are shown in the bottom panel. WHAM fails to converge with 100 or fewer data points per window, while VFEP still delivers qualitatively correct results with only 10 data points per window.

