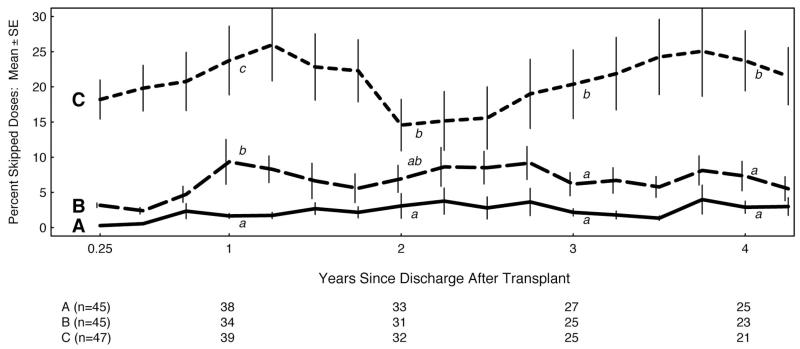
FIGURE 2.
The mean percent (±SE) of skipped azathioprine doses quarterly for each initial adherence tertile. The three tertiles, labeled A, B, and C, were statistically compared at 1, 2, 3, and 4 years after transplant. For each annual comparison, curves with different lower case letters (a, b, or c) are statistically significantly different (P<.05), while those sharing a letter are not significantly different. The number of participants remaining in each tertile annually is shown in the table immediately below the graph.

