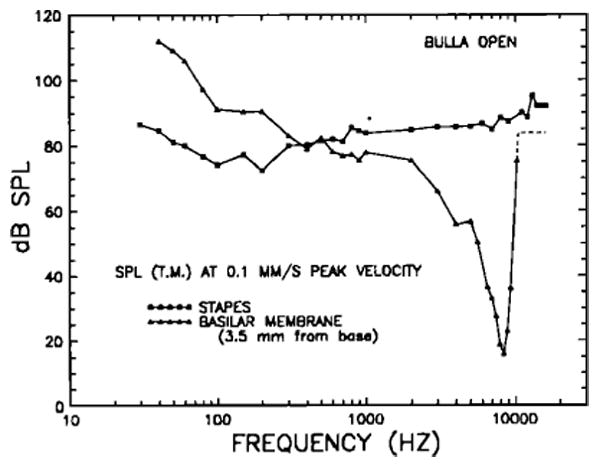
FIG. 18.

Mean isovelocity frequency-response curves for the stapes and for a basilar membrane site 3.5 mm from its basal end. The ordinate indicates the stimulus SPL at the tympanic membrane required to elicit 0.1 -mm/s responses. Both sets of data were obtained in chinchilla ears with open bullas. The BM data are means for five sensitive preparations and have been previously described in detail (Robles et al., 1986,; Ruggero et al., 1986c,d). Above 10 kHz, the BM response appears to reach a plateau (dashed line).
