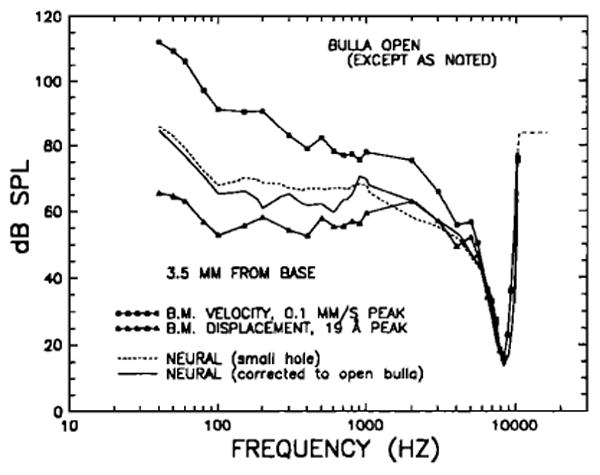
FIG. 22.

Basilar membrane isovelocity (squares) and isodisplacement (triangles) tuning curves for a site 3.5 mm from the cochlear base, compared with a mean cochlear-afferent rate-threshold tuning curve. The BM curves, which were collected with open bullas, are those presented by Ruggero et al. (1986d) in their Fig. 3 (see also Fig. 11 of Robles et al., 1986). The neural tuning curves (continuous and dashed lines) represent a synthesis based on recordings from 63 cochlear-afferent fibers innervating ears with bullas vented via single small (1–2 mm) holes (Ruggero et al., 1986d). The short-dash line indicates the “raw” neural data, as originally collected. The continuous line indicates the same data after correction for the difference in transmission in middle ears widely opened or vented via a single small hole (Fig. 5).
