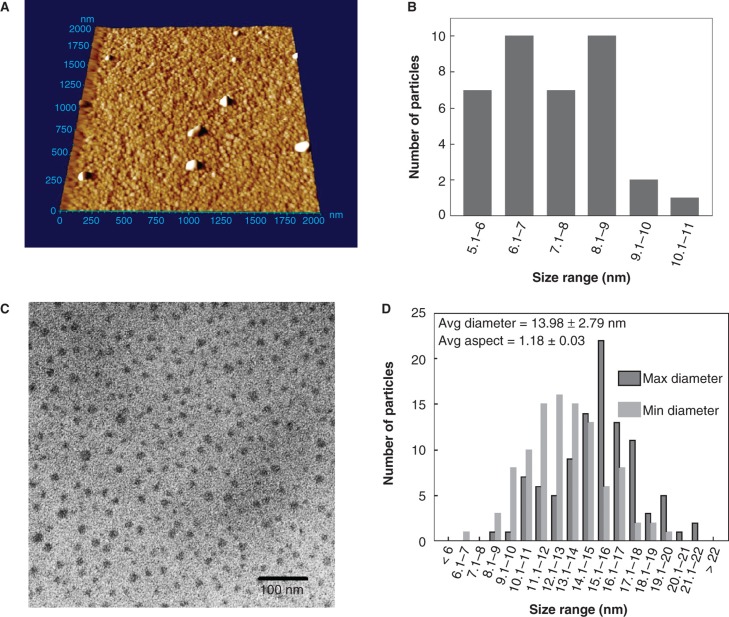
Figure 2.
Analysis cadmium telluride quantum dots (CdTe-QDs) by atomic force microscopy (AFM) and transmission electron microscopy (TEM). (A) AFM image of full commercial concentration of CdTe-QD deposited on freshly cleaved mica. The samples were also diluted to 20 μg/ml and deposited onto cleaved mica for AFM and formvar-coated copper grids for TEM. (B) Summary of Z-dimension size measurements of diluted CdTe-QDs as measured by AFM. (C) TEM image of diluted CdTe-QDs. (D) The diameter of each individual CdTe-QDs was measured at its minimum and maximum dimensions. These measurements were used to estimate the average aspect ration as a measure of sphericity, where 1 is an ideal circle.

