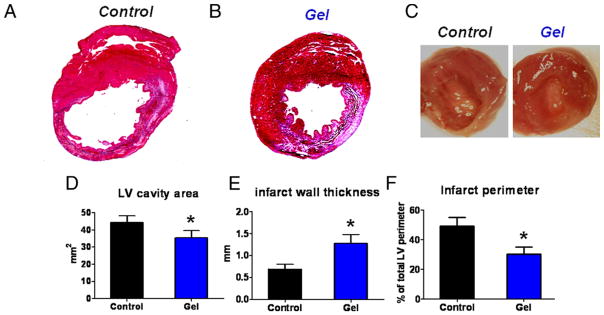
Figure 5. Morphometry Analysis.

(A, B) Representative Masson’s trichrome-stained myocardial sections 3 weeks after treatment. Scar tissue and viable myocardium are identified by blue and red, respectively. (C) White light photos of excised hearts from control- and gel-treated animals. (D to F) Quantitative analysis and left ventricular (LV) morphometric parameters of the Masson’s trichrome images (n = 5 animals per group).
