
Figure 1.
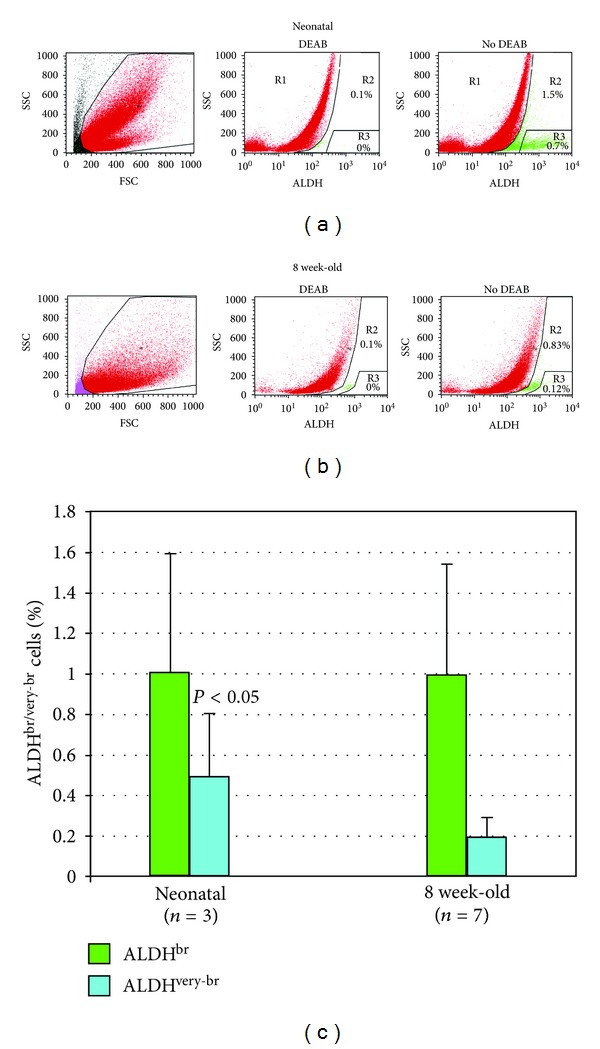
Identification of ALDHbr cells in populations isolated from whole hearts from neonatal and young adult mice. Flow cytometric analysis of ALDH activity (a). Neonatal mice. Left panel: cells were selected according to forward scatter (FSC) and side scatter (SSC) properties using the gated region. Middle panel: cells incubated with Aldefluor substrate and the specific inhibitor of ALDH, DEAB were used to establish baseline fluorescence of these cells and to define the ALDHbr (R2) and the ALDHvery-br (R3) region as less than 0.1% and 0% of total events, respectively. Right panel: cell incubation with Aldefluor substrate in the absence of inhibitor induced a shift in FL1 fluorescence defining the ALDHdim (R1), the ALDHbr (R2), and the ALDHvery-br (R3) populations (b). Eight-week-old mice (c). Bar histogram showing ALDHbr and ALDHvery-br cell percentages (mean, SD) in neonatal and young adult mice. P value refers to the difference between neonatal and 8 week-old mice.