
Figure 2.
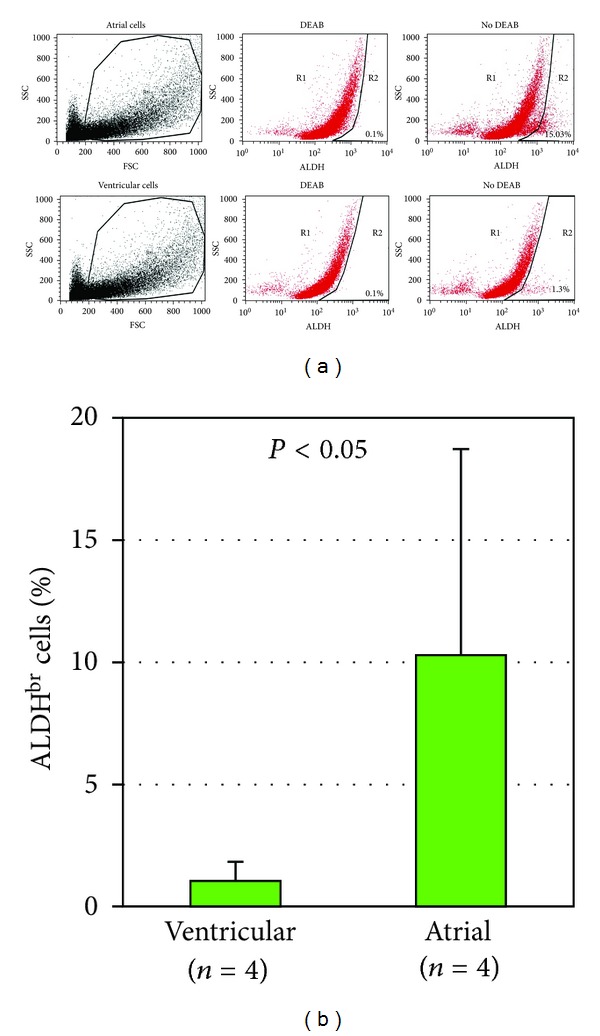
Identification of ALDHbr cells in the atrial and ventricular population from 8 week-old mice. Flow cytometric analysis of ALDH activity (a). Left panels: atrial and ventricular cells were selected according to forward scatter (FSC) and side scatter (SSC) properties using the gated region. Middle panels: cells incubated with Aldefluor substrate and the specific inhibitor of ALDH, DEAB, were used to establish baseline fluorescence of these cells and to define the ALDHbr region (R2) as less than 0.1% of total events. Right panels: cell incubation with Aldefluor in the absence of inhibitor induced a shift in FL1 fluorescence defining the ALDHdim (R1) and the ALDHbr (R2) population. In the example shown, not all of the atrial cells exhibiting a shift in FL1 fluorescence in the absence of inhibitor were found in the gated region R2, suggesting that atrial ALDHbr cells may have been underestimated (b). Bar histogram showing percent ALDHbr cells (mean, SD) in the ventricular and atrial population.