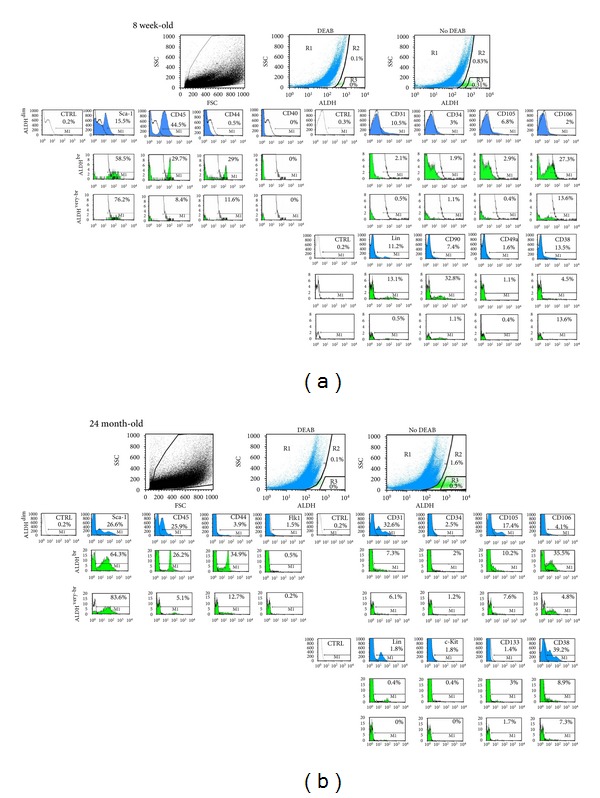
Figure 3.

Freshly isolated ALDHbr cells from young adult hearts (upper panel; (a)) and from aging hearts (lower panel; (b)) were analyzed by flow cytometry for ALDH expression in combination with the expression of cell-surface markers. Cells were incubated with Aldefluor substrate and an inhibitor of ALDH (DEAB), or with Aldefluor alone, to establish R1, R2, and R3 gates for ALDHdim (blue), ALDHbr, and ALDHvery-br cells (both green), respectively. These populations were subsequently analyzed for expression of markers. Cytograms for each surface marker in each cell population are shown (the surface markers indicated for the cytograms of ALDHdim cells also refer to the cytograms of the respective ALDHbr and ALDHvery-br populations; corresponding cytograms are aligned vertically. Percentages of positive cells are indicated (CTRL; isotype-matched irrelevant IgG).
